Health Sciences Campus Demographics

Health Sciences Campus Demographics
Student Demographics
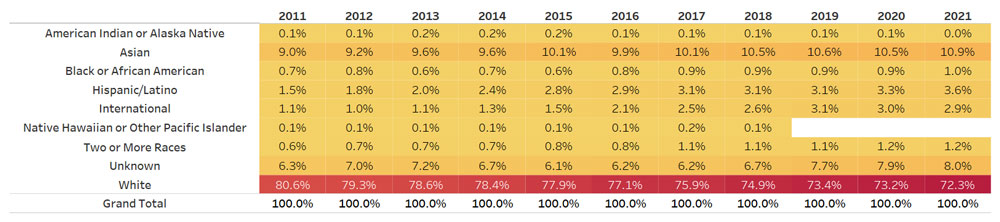
We are excited to share this data with you. The data represents over 10 years of student demographic trends over time, from Fall 2011 to Fall 2022. Of note, the Latinx (Hispanic or Latino) student representation has nearly tripled over the last decade, and the Asian student representation has doubled over the same time period. This is largely due to the excellent work in the undergraduate space in the Colleges of Health and Nursing. The graduate programs have improved at a much slower rate, but large demographic shifts in the Physician Assistant and Biomedical Sciences PhD programs have been drivers of the demographics in the graduate space. We recognize that students who identify as Black or African American, American Indian/Alaska Native or Native Hawaiian/Other Pacific Islander, have largely been represented at the same level for the past decade. It is important to note however, that while we serve the state of Utah we recruit nationally for students and our student population still has a long way to go to approach national population parity.
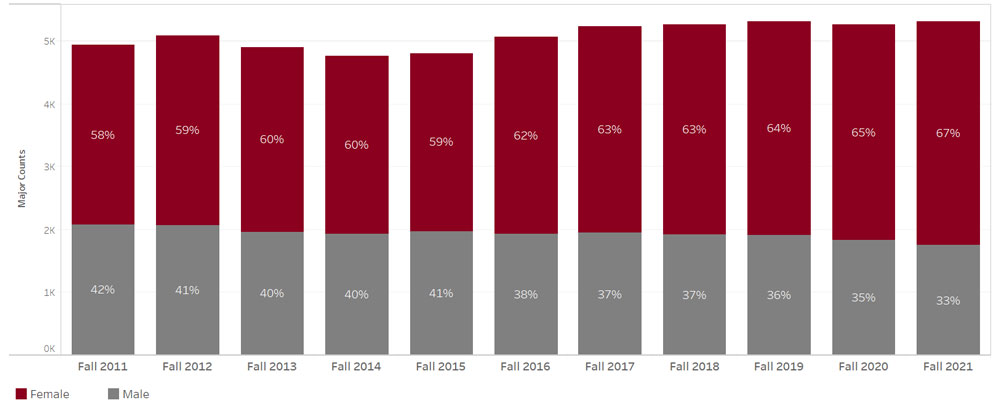
Students: Health Science Trends by Race/Ethnicity*
*Figures reflect undergrad and graduate students in Health Sciences (Medicine, Pharmacy, Nursing, Dentistry, College of Health)
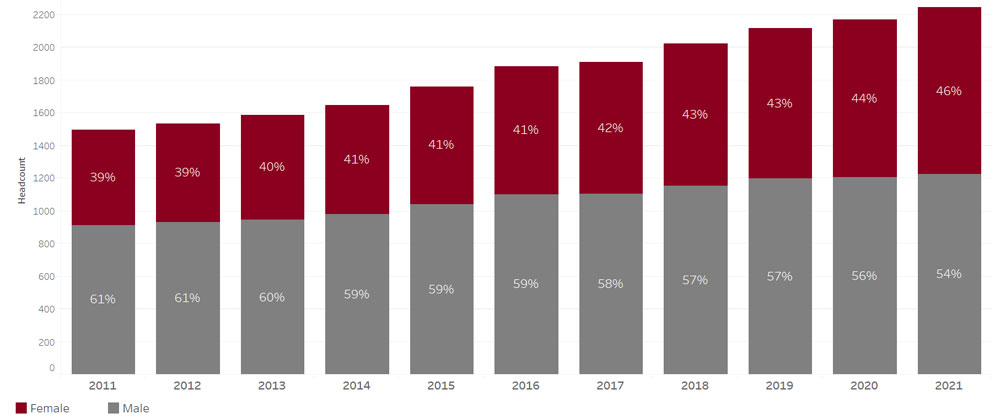
Students: Health Sciences Trends by Sex
Faculty Representation
In the faculty space, we see there is a doubling in the Latinx space whereas other groups have not experienced growth. Asian faculty numbers have remained flat over the decade, while nationally, those who identify as Asian make up about 25% of medical school faculties. When it comes to women faculty, we are approaching population parity again due to the excellent work done in the colleges of Nursing, Pharmacy and Health. Because the school of medicine has such a large faculty, demographic shifts in that faculty population also play a role in our slow but steady approach toward gender parity. We look forward to seeing an acceleration in the rate of change now that we have a better picture of who we are.
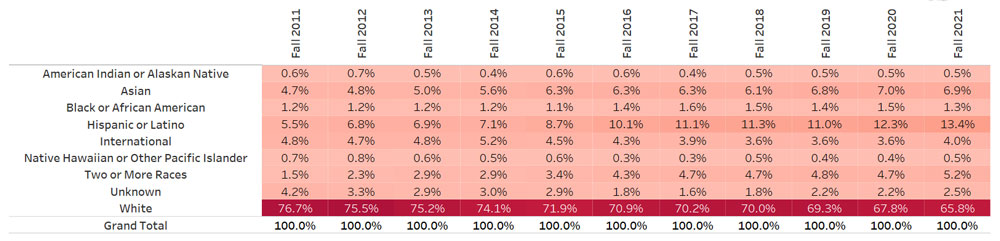
Faculty: Health Sciences Trends by Race/Ethnicity*
* Figures include faculty with a primary, regular appointment in Health Sciences (Medicine, Pharmacy, Nursing, Dentistry, College of Health)